
What Skills Are Required to Become a Data Analyst?
Choosing a data analytics course in Bangalore BTM Layout is only the first step toward becoming a data analyst. The essential skills include Excel, SQL, data cleaning, statistics, data visualization, Python, business understanding, and communication; practical projects prove that you can turn raw data into reliable business insights.
Written by: Senior Data Analytics Trainer at Ascent Software Training
Published: August 25, 2026
Last updated: August 25, 2026
Reading time: 10–12 minutes
A data analyst helps an organization understand what is happening, why it is happening, and what should happen next.
The work may involve:
- Examining sales or customer data.
- Writing SQL queries.
- Cleaning spreadsheets and database tables.
- Building Power BI or Tableau dashboards.
- Measuring marketing or product performance.
- Finding unusual patterns.
- Explaining results to managers.
- Recommending practical next steps.
A beginner does not need to master every technology before starting. The better approach is to build a strong foundation, practise with realistic datasets, and gradually add advanced skills.
What Does a Data Analyst Do?
A data analyst collects, prepares, examines, visualizes, and communicates data to support business decisions. The role typically includes defining metrics, querying databases, checking data quality, identifying trends, preparing reports, and explaining insights to non-technical stakeholders.
For example, a company may ask:
“Why did our online orders decline in March?”
A data analyst might:
- Confirm how “online orders” is defined.
- Compare March with previous months.
- Check whether the data is complete.
- Break orders down by device, location, product, and customer type.
- Investigate website traffic and checkout performance.
- Build a dashboard.
- Explain the main findings.
- Suggest what the business should test next.
The important point is that analysis begins with a business question, not with a dashboard tool.
Which Technical Skills Should a Beginner Learn First?
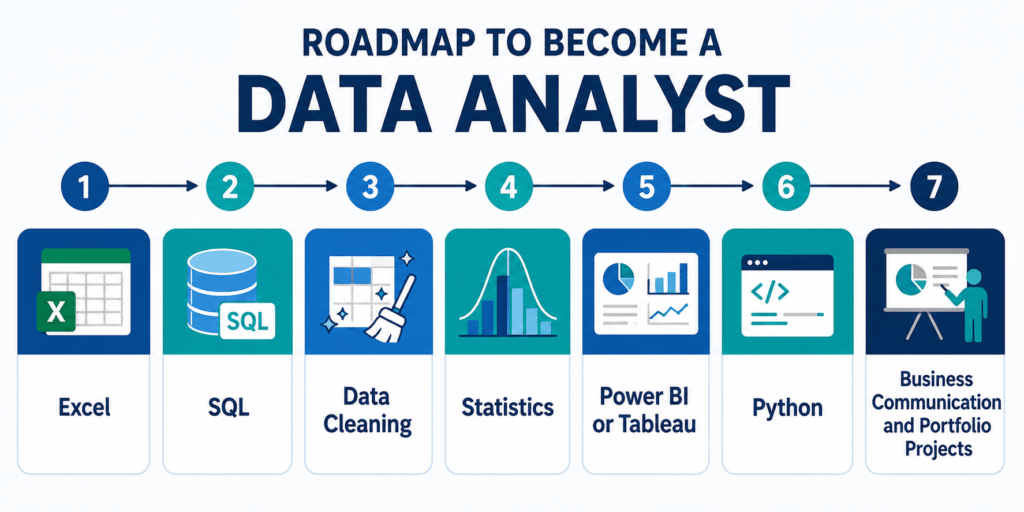
A beginner should learn spreadsheets, SQL, data cleaning, basic statistics, data visualization, and business communication first. Python, Power BI or Tableau, data modeling, cloud platforms, and AI-assisted workflows can be added after the fundamentals are comfortable.These skills form the foundation of Data Analytics and are essential for building practical, job-ready expertise.
A practical roadmap for learning data analytics skills in Bangalore.
A useful learning order is:
- Excel or Google Sheets.
- SQL.
- Data cleaning.
- Statistics.
- Power BI or Tableau.
- Python.
- Portfolio projects.
- Interview and communication skills.
This sequence is practical because it moves from simple data inspection to database analysis, visualization, automation, and job-ready application.
Why Are Excel and Spreadsheets Important for Data Analysts?
Excel and Google Sheets help analysts inspect data, calculate metrics, create quick reports, and collaborate with teams. Important skills include formulas, PivotTables, lookups, conditional calculations, charts, data validation, and basic Power Query.
A practical data analytics course in Bangalore BTM Layout should teach Excel through real reporting tasks such as data cleaning, PivotTables, formulas, and KPI summaries.
Learn how to use:
- XLOOKUP or equivalent lookup functions.
- SUMIFS and COUNTIFS.
- IF, IFS, and conditional logic.
- Date and text functions.
- PivotTables and PivotCharts.
- Filters and sorting.
- Data validation.
- Duplicate checks.
- Power Query basics.
- Simple dashboard layouts.
For example, a retail analyst may use a PivotTable to compare monthly revenue by product category and location.
However, spreadsheet proficiency is not simply knowing many formulas. You must also check:
- Whether rows are duplicated.
- Whether dates use the same format.
- Whether revenue includes refunds.
- Whether blank values represent zero or missing information.
- Whether the calculation matches the business definition.
A spreadsheet can produce a confident-looking answer that is still wrong.
Why Is SQL Essential for a Data Analyst?
SQL is used to retrieve, filter, join, summarize, and analyze data stored in relational databases. It is one of the most important skills for data analyst roles because companies usually store operational data in databases or cloud data warehouses.
SQL is a core part of a data analytics course in Bangalore BTM Layout because analysts often work with information stored across multiple related database tables.
A job-ready beginner should understand:
- SELECT.
- WHERE.
- ORDER BY.
- GROUP BY.
- HAVING.
- COUNT, SUM, AVG, MIN, and MAX.
- Inner and left joins.
- CASE WHEN.
- Subqueries.
- Common table expressions.
- Date functions.
- Null values.
- Duplicate records.
- Window functions such as RANK, ROW_NUMBER, and LAG.
What SQL project should a beginner practise?
A beginner can analyse an e-commerce database containing customers, orders, products, and payments. The project could answer questions such as:
- What are the monthly sales trends?
- Which products generate the highest revenue?
- Which customers purchase repeatedly?
- What is the average order value?
- Which regions have the highest cancellation rate?
- How long does it take for customers to make a second purchase?
The goal is not to write complicated queries for their own sake. The goal is to retrieve accurate data that supports a decision.
What Data-Cleaning Skills Do Analysts Need?
Data cleaning means identifying and correcting incomplete, inconsistent, duplicated, incorrectly formatted, or inaccurate data before analysis. Analysts need to understand how poor data quality affects calculations, dashboards, reports, and business decisions.
Common cleaning tasks include:
- Removing duplicate records.
- Standardizing categories.
- Formatting dates consistently.
- Handling missing values.
- Correcting spelling variations.
- Checking invalid values.
- Matching IDs across tables.
- Confirming currencies and units.
- Recording every transformation.
Consider a location column containing:
- Bangalore.
- Bengaluru.
- Bengaluru Urban.
- BLR.
If these values represent the same location but are not standardized, a regional report may show misleading totals.
A trustworthy analyst maintains a cleaning log that records:
- What was changed.
- Why it was changed.
- Which rows were affected.
- Which assumptions were made.
- What limitations remain.
How Much Statistics Does a Data Analyst Need?
A data analyst needs practical statistics to summarize data, compare groups, measure variation, identify uncertainty, and avoid misleading conclusions. Beginners should first learn descriptive statistics, then study probability, sampling, confidence intervals, hypothesis testing, correlation, and regression basics.
Start with:
- Mean and median.
- Mode and percentiles.
- Range and standard deviation.
- Distributions.
- Outliers.
- Sampling.
- Sampling bias.
- Correlation and causation.
- Confidence intervals.
- Hypothesis testing.
- A/B testing.
- Basic regression.
For example, suppose customers who received a promotional email spent more than customers who did not. That result does not automatically prove that the email caused the difference. The groups may have differed in previous purchase activity, location, income, or customer loyalty.
Statistics helps you ask whether a pattern is meaningful, reliable, and relevant.

Do Data Analysts Need Python?
Python is not always mandatory for entry-level analyst roles, but it is increasingly useful for automation, data cleaning, statistical analysis, and working with larger or more complex datasets. A beginner should focus on Pandas, NumPy, Matplotlib, Seaborn, and Jupyter Notebook.
Learn Python concepts such as:
- Variables and data types.
- Lists and dictionaries.
- Conditions.
- Loops.
- Functions.
- File handling.
- Error handling.
- Data frames.
- Filtering and grouping.
- Merging datasets.
- Basic visualizations.
Python is useful when you need to:
- Combine many monthly files.
- Repeat the same cleaning workflow.
- Analyse data that is too large for Excel.
- Create a reproducible notebook.
- Connect to an approved API.
- Generate a recurring report.
A practical Python project could combine twelve monthly sales files, standardize their columns, remove duplicates, calculate revenue by region, and export a clean summary.
The aim is not to become a full-time software developer. The aim is to make analysis more efficient and repeatable.
Should a Data Analyst Learn Power BI or Tableau?
A beginner should learn one business intelligence tool deeply enough to clean data, create relationships, define measures, design dashboards, and explain insights. Power BI and Tableau are both useful; SQL, data modeling, and analytical thinking are transferable between them.
|
Area |
Power BI |
Tableau |
|
Common strength |
Microsoft-centered reporting and business intelligence |
Visual exploration and interactive analytics |
|
Important skills |
Power Query, relationships, DAX, semantic models |
Dimensions, measures, calculated fields, dashboard actions |
|
Beginner focus |
Data import, modeling, measures, filters |
Data connections, calculations, visual design |
|
Transferable knowledge |
KPIs, chart selection, data quality, storytelling |
KPIs, chart selection, data quality, storytelling |
|
Best approach |
Build two or three complete dashboards |
Build two or three complete dashboards |
Microsoft describes Power BI data modeling as preparing data into a semantic model with relationships and calculations. DAX is used to create calculations that support deeper analysis in Power BI models.learn.microsoft+1
Do not learn both platforms superficially. First become capable with one, then learn the second when your target roles require it.
What Business Skills Do Data Analysts Need?
Data visualization skills help analysts present comparisons, trends, distributions, relationships, and exceptions clearly. A good visualization answers a specific question and helps the reader understand what action may be appropriate.
Use:
- Line charts for trends over time.
- Bar charts for category comparisons.
- Scatter plots for relationships.
- Histograms for distributions.
- Tables when exact values matter.
- KPI cards for a limited number of important metrics.
- Maps only when location is central to the analysis.
A useful dashboard should make these points obvious:
- What is being measured?
- What period does it cover?
- What is the comparison?
- Is the result improving or declining?
- Which segment is responsible?
- What should the viewer investigate next?
Avoid:
- Three-dimensional charts.
- Too many colors.
- Unnecessary pie charts.
- Unlabeled axes.
- Dashboard pages crowded with unrelated KPIs.
- Charts that hide the denominator.
For instance, “100 additional complaints” may sound serious, but the meaning changes if the company handled 1,000 orders rather than 1 million.
What Business Skills Do Data Analysts Need?
Business skills help analysts define useful questions, understand processes, select meaningful KPIs, and connect findings to decisions. The most important skills are problem framing, metric definition, domain understanding, stakeholder management, critical thinking, and prioritization.
A stakeholder may say:
“Please create a customer dashboard.”
A good analyst asks:
- Which decision will the dashboard support?
- Who will use it?
- What does “customer” mean?
- Is the main goal acquisition, retention, or revenue?
- Which date should determine customer activity?
- How frequently should the dashboard update?
- What action should follow from a change in the numbers?
Without this clarification, analysts can produce attractive reports that solve the wrong problem.
Why Is Communication Important for Data Analysts?
Communication allows analysts to explain technical findings in language that managers, marketers, operations teams, and clients can understand. A clear analyst presents the finding, evidence, assumptions, limitations, and recommended next step without exaggerating the result.
Compare these two statements:
“The dashboard shows a negative trend.”
With:
“Repeat purchases declined among first-time mobile customers in March, while desktop retention remained stable. The next investigation should focus on the mobile checkout and payment process.”
The second statement is more useful because it identifies:
- The affected group.
- The time period.
- The comparison.
- The likely direction of investigation.
Practise communication through:
- Short insight summaries.
- Annotated charts.
- Presentation slides.
- Metric documentation.
- Interview explanations.
- Stakeholder-style emails.
What AI Skills Should a Data Analyst Develop in 2026?
Data analysts should use AI to accelerate query drafting, documentation, data exploration, and explanation while personally validating the output. AI-generated SQL, Python, summaries, or visual recommendations can contain incorrect assumptions, faulty joins, privacy risks, or unsupported conclusions.
Useful AI-assisted tasks include:
- Drafting a first SQL query.
- Explaining unfamiliar code.
- Suggesting data-quality checks.
- Generating documentation templates.
- Summarizing a dashboard for a non-technical audience.
- Brainstorming possible reasons for an anomaly.
- Creating interview practice questions.
- Translating a technical insight into plain language.
Use AI responsibly:
- Do not paste confidential data into unapproved tools.
- Check every join and filter.
- Verify totals against a known source.
- Review date and timezone logic.
- Test code with sample cases.
- Record important assumptions.
- Do not present an AI suggestion as a confirmed business finding.
In 2026, the valuable skill is not simply prompting an AI system. It is knowing whether its answer is valid.
Which Tools Should a Data Analyst Learn in 2026?
A practical 2026 analyst toolkit includes Excel or Google Sheets, SQL, Power BI or Tableau, Python, a database environment, and basic cloud-data concepts. Tools should be learned as part of an end-to-end workflow rather than as disconnected software packages.
|
Skill area |
Tools to consider |
What job-ready ability looks like |
|
Spreadsheets |
Excel, Google Sheets |
Cleaning, formulas, pivots, quick reporting |
|
SQL |
MySQL, PostgreSQL, SQL Server |
Joins, CTEs, windows, reliable metrics |
|
BI |
Power BI, Tableau |
Modeling, measures, dashboard storytelling |
|
Python |
Pandas, NumPy, Jupyter |
Cleaning, automation, analysis |
|
Statistics |
Excel, Python, R |
Testing, distributions, regression basics |
|
Cloud data |
BigQuery, Snowflake, Redshift |
Querying warehouse data and understanding access |
|
Collaboration |
Git, documentation tools |
Reproducible work and clear handoffs |
|
AI assistance |
Approved workplace tools |
Faster analysis with human validation |
Google’s data analytics learning materials include spreadsheets, SQL, Tableau, R, Python, visualization, presentation, and practical case-study skills.grow+1
Do not add a tool to your resume because you watched one tutorial. Add it when you can use it to complete and explain a meaningful project.
How Can a Beginner Build a Data Analyst Portfolio?
A strong beginner portfolio contains two to four complete case studies showing the path from business question to recommendation. Each project should include data preparation, analysis, visualization, validation, limitations, and a clear explanation of the decision the work supports.
What projects should a beginner create?
1. E-commerce sales analysis
Analyse orders, customers, products, payments, and returns.
Show:
- Monthly revenue.
- Average order value.
- Product performance.
- Repeat-purchase rate.
- Cancellation rate.
- Regional comparisons.
2. SaaS customer churn analysis
Analyse customers by plan, tenure, usage, support tickets, and renewal status.
Show:
- Churn by plan.
- Retention by customer age.
- Usage differences.
- At-risk segments.
- Limits of predicting churn from historical data.
3. Marketing campaign analysis
Analyse campaign spend, impressions, leads, conversions, and revenue.
Show:
- Cost per lead.
- Conversion rate.
- Customer acquisition cost.
- Return on ad spend.
- Attribution limitations.
4. Bangalore operations analysis
Use a realistic service or operations dataset to analyse:
- Turnaround time.
- Workload by location.
- Request categories.
- Delays.
- Team capacity.
- Weekly trends.
A project should contain:
- Problem statement.
- Dataset description.
- Data dictionary.
- Cleaning process.
- SQL queries or Python notebook.
- Dashboard.
- Three to five findings.
- Business recommendations.
- Limitations.
- Contact or repository information.
Do not claim that your project increased revenue unless you measured the result in a real business environment. Say “recommended” or “identified an opportunity” when the outcome has not yet been tested.
A practical data analytics course Bangalore program should help learners create original case studies using Excel, SQL, Python, Power BI, and realistic business datasets.
What Mistakes Should Beginners Avoid?
The most common beginner mistakes are learning tools without applying them, copying tutorial dashboards, skipping data validation, confusing correlation with causation, and relying on certificates without building evidence of skill.
Avoid these habits:
- Memorizing SQL syntax without solving business problems.
- Listing Python without a working project.
- Building dashboards with undefined KPIs.
- Treating missing values as zero automatically.
- Ignoring duplicate rows.
- Reporting averages without segment analysis.
- Using a chart simply because it looks attractive.
- Uploading confidential data to public AI tools.
- Copying a portfolio project without understanding it.
- Believing guaranteed-placement or guaranteed-salary claims without written evidence.
A trustworthy learning or career resource should identify its author, show when it was updated, distinguish sourced facts from opinion, and explain limitations. Google recommends people-first, reliable content and accurate author bylines where readers reasonably want to know who created the material.developers.google+1
What Is the Best Data Analyst Learning Roadmap?
The most practical roadmap is to learn spreadsheets, SQL, statistics, visualization, Python, portfolio development, and interview communication in sequence while applying each skill to realistic datasets. Job readiness comes from repeated practice and feedback, not from completing videos alone.
A six-stage roadmap
- Learn spreadsheet analysis
- Formulas, PivotTables, cleaning, charts, and basic reporting.
- Build SQL confidence
- Joins, aggregations, CTEs, subqueries, windows, and date logic.
- Study practical statistics
- Distributions, sampling, confidence intervals, testing, and regression basics.
- Learn one BI platform
- Data preparation, relationships, measures, filters, and dashboard design.
- Add Python
- Pandas cleaning, automation, visualizations, and notebooks.
- Build and explain projects
- Publish case studies, practise interviews, and learn to communicate findings.
At every stage, create a deliverable:
- Spreadsheet report.
- SQL analysis.
- Statistical comparison.
- BI dashboard.
- Python notebook.
- Complete portfolio case study.
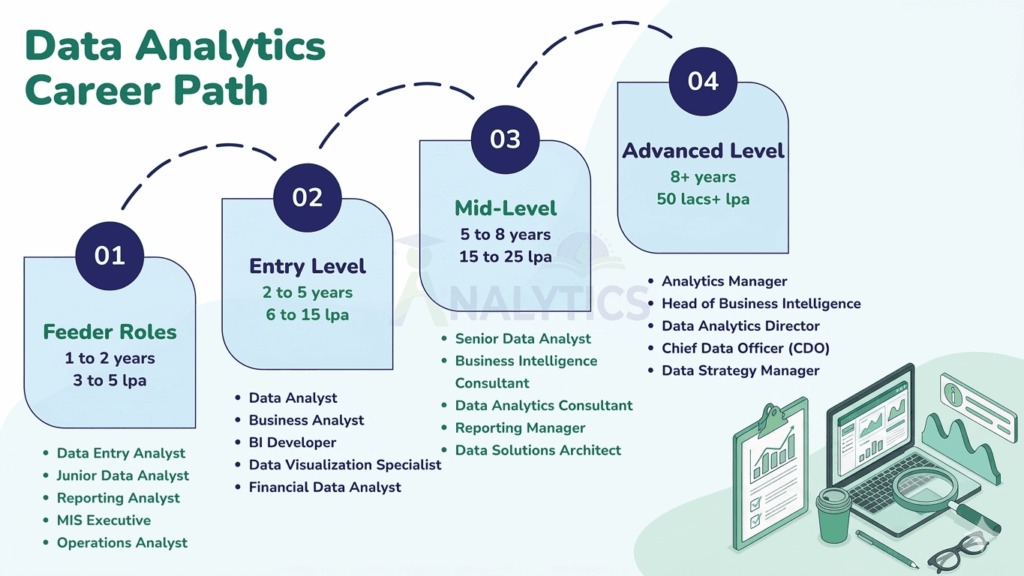
What Salary Can a Data Analyst Expect in Bangalore?
Data analyst salaries in Bangalore vary according to experience, employer, industry, technical depth, degree, and interview performance. Public 2026 salary references report different figures; one AmbitionBox result lists an average Bengaluru data analyst salary of about ₹6.8 lakh per year, while other public guides place fresher and mid-level ranges differently.ambitionbox+1
The following figures are directional benchmarks, not guaranteed offers:
|
Experience |
Indicative annual CTC |
What can influence the offer |
|
Fresher / 0–1 year |
₹3.5–7 LPA |
SQL, projects, communication, internships, employer |
|
1–3 years |
₹6–12 LPA |
Dashboard ownership, Python, domain knowledge |
|
3–6 years |
₹10–20 LPA |
Advanced analytics, experimentation, business impact |
|
Senior or lead |
₹15 LPA and above |
Leadership, strategy, specialization, scope |
Salary source note: Public salary figures vary by source methodology, job title, sample size, location definition, and whether the number represents base pay or total CTC. Verify the current role description and compensation structure before comparing offers.
Bangalore’s technology ecosystem includes startups, fintech companies, e-commerce firms, consulting organizations, software companies, and global capability centers. Opportunities appear across areas such as BTM Layout, Koramangala, the Outer Ring Road, Whitefield, Electronic City, and Manyata Tech Park.
Location may help with networking and training access, but skills and evidence of work matter more than the address on a course brochure.
What Should You Check Before Joining a Data Analyst Course in Bangalore?
Choose a course by checking curriculum depth, trainer experience, project feedback, assessment quality, interview preparation, schedule, and transparent placement-support terms. A good program should teach an integrated analyst workflow instead of offering isolated demonstrations of Excel, SQL, Python, or Power BI.
Skills required to become a data analyst including Excel SQL statistics Power BI and Python
If you are considering a data analytics course in Bangalore, ask:
- Does the curriculum cover SQL joins, CTEs, and window functions?
- Are statistics and data cleaning taught with practical examples?
- Does the BI module include data modeling and calculated measures?
- Will trainers review individual projects?
- Are datasets realistic and original?
- Is Python taught for analysis rather than only syntax?
- Are mock interviews included?
- What does placement support actually include?
- Are placement results documented and independently verifiable?
- Can you speak with recent learners?
- Are course fees, duration, refund terms, and deliverables clearly stated?
The best data analytics training in Bangalore is not necessarily the one with the longest tool list. It is the one that helps learners repeatedly practise the complete process: question, data, analysis, validation, visualization, insight, and communication.
Is Data Analytics Training and Placement in Bangalore Worth It?
Data analytics training and placement in Bangalore may be worthwhile when it offers structured practice, trainer feedback, portfolio development, interview preparation, and transparent career support. Placement assistance should not be interpreted as a guaranteed job, salary, or role unless the written terms explicitly say so.
|
Area to evaluate |
Positive signal |
Warning sign |
|
Curriculum |
SQL, statistics, BI, Python, and projects |
Only a list of software names |
|
Projects |
Reviewed, documented, business-oriented |
Copied tutorial dashboards |
|
Trainers |
Practical explanations and feedback |
No identifiable trainer |
|
Placement support |
Interview preparation and clear process |
Guaranteed job claims |
|
Assessments |
Tests and project reviews throughout |
No evaluation until the end |
|
Transparency |
Written terms and role definitions |
Vague salary promises |
For learners in BTM Layout, classroom or hybrid learning can be useful if it improves consistency, access to feedback, and peer practice. Proximity alone should not determine your choice
What Questions Are Asked in Data Analyst Interviews?
Data analyst interviews commonly test SQL, spreadsheet logic, statistics, dashboard interpretation, data quality, business reasoning, and communication. You should be able to explain not only what you calculated but also why you chose the method and how you validated the result.
Practise questions such as:
- How would you investigate a sudden fall in revenue?
- What is the difference between WHERE and HAVING?
- When would you use a left join?
- How do you identify duplicate records?
- How would you handle missing values?
- When is the median better than the mean?
- What is the difference between correlation and causation?
- How would you measure an A/B test?
- How did you validate your portfolio project?
- What would you do if two departments use different definitions for the same KPI?
Use this answer structure:
- Clarify the business question.
- State assumptions.
- Identify the data required.
- Explain the analysis.
- Validate the result.
- Communicate the finding.
- Recommend a next step.
What makes advice about data analyst careers trustworthy?
Career advice is more trustworthy when it identifies the author, displays publication and update dates, cites market figures, separates benchmarks from guarantees, explains limitations, and uses practical examples that readers can verify.
When comparing a data analytics course in Bangalore BTM Layout, review the project feedback, trainer support, assessment process, and interview preparation instead of relying only on the tool list.
Before relying on an article, course page, or salary claim, check:
- Is a real author named?
- Is the author’s experience relevant?
- Is the content dated?
- Are numbers attributed to a source?
- Does the source define its methodology?
- Are salary figures labeled as CTC or take-home?
- Are placement claims supported by written details?
- Are examples realistic rather than exaggerated?
- Does the page acknowledge uncertainty?
Structured data can help search engines understand a page, but it must describe visible, accurate content. Google recommends JSON-LD as a supported structured-data format and warns against misleading or irrelevant
markup.developers.google+1
What is the shortest answer about data analyst skills?
The essential skills required to become a data analyst are Excel, SQL, data cleaning, basic statistics, data visualization, and communication. Add Python, Power BI or Tableau, data modeling, cloud basics, AI validation, and portfolio projects to become more competitive in Bangalore’s analyst job market.
The most convincing proof of skill is a complete project that starts with a business question and ends with a validated recommendation.
Frequently Asked Questions About Data Analyst Skills
Is coding required to become a data analyst?
Advanced software engineering is not required, but SQL is essential for many analyst roles and Python is increasingly valuable for automation, larger datasets, and repeatable analysis.
Can a non-technical student become a data analyst?
Yes. Students from commerce, business, engineering, science, economics, and other backgrounds can enter analytics by learning the tools, practising consistently, and building practical projects.
How long does it take to learn data analytics?
The time depends on your starting level and weekly practice. A focused learner may build foundational skills in several months, but job readiness also requires projects, feedback, interview preparation, and communication practice.
Should I learn Power BI or Tableau first?
Choose one platform based on your target roles and learn it deeply. Power BI and Tableau are both valuable, while SQL, data modeling, KPI design, and analytical reasoning transfer between them.
Is a certificate enough to get a data analyst job?
No. A certificate can provide structure, but employers also evaluate SQL, statistics, dashboard ability, projects, communication, problem-solving, and interview performance.
What is the starting salary for a data analyst in Bangalore?
Public 2026 references commonly place fresher salaries around ₹3.5–7 LPA, but actual offers vary according to employer, skills, degree, internships, role responsibilities, and interview performance.ambitionbox+1
Is data analytics a good career in Bangalore?
It can be a strong career option because Bangalore has technology companies, startups, fintech firms, e-commerce businesses, consulting organizations, and global capability centers that use data for decision-making.
How Do You Choose a Data Analytics Course in Bangalore BTM Layout?
Check the trainer’s experience, course depth, project review process, SQL and BI coverage, Python and statistics modules, assessments, interview preparation, and written placement-support terms.
A practical data analytics course in Bangalore should help learners create original case studies using Excel, SQL, Python, Power BI, and realistic business datasets.
xml
- Data analyst career roadmap.
- Skills for a data analytics job.
- Beginner’s guide to SQL and Power BI.
- How to build a data analytics portfolio.
When comparing a data analytics course Bangalore option, review the curriculum, trainer feedback, project work, interview preparation, and placement-support terms
CTA
Want guided practice with SQL, Excel, Python, Power BI, statistics, and real-world portfolio projects?
If you are searching for a data analytics course in Bangalore BTM Layout, speak with the institute about its curriculum, practical projects, class format, and placement-support process before enrolling.
Contact Ascent Software Training Institute to discuss the curriculum, class format, project support, interview preparation, and placement-support process before enrolling.
Address: 100 Ft Ring Road, BTM 1st Stage, Landmark: Above Apollo Pharmacy, Bangalore – 29
Phone: 080-42191321
Mobile: 9035037886
Email: hr@ascentcourses.com
Tags: Data Analyst Skills, Data Analytics, Data Analytics Careers, Power BI, Python for Data Analysis, SQL